The AI race, measured
Unbiased, data-driven research on the AI race. Who's actually winning, how fast it's moving, and what it means.
Chart of the day
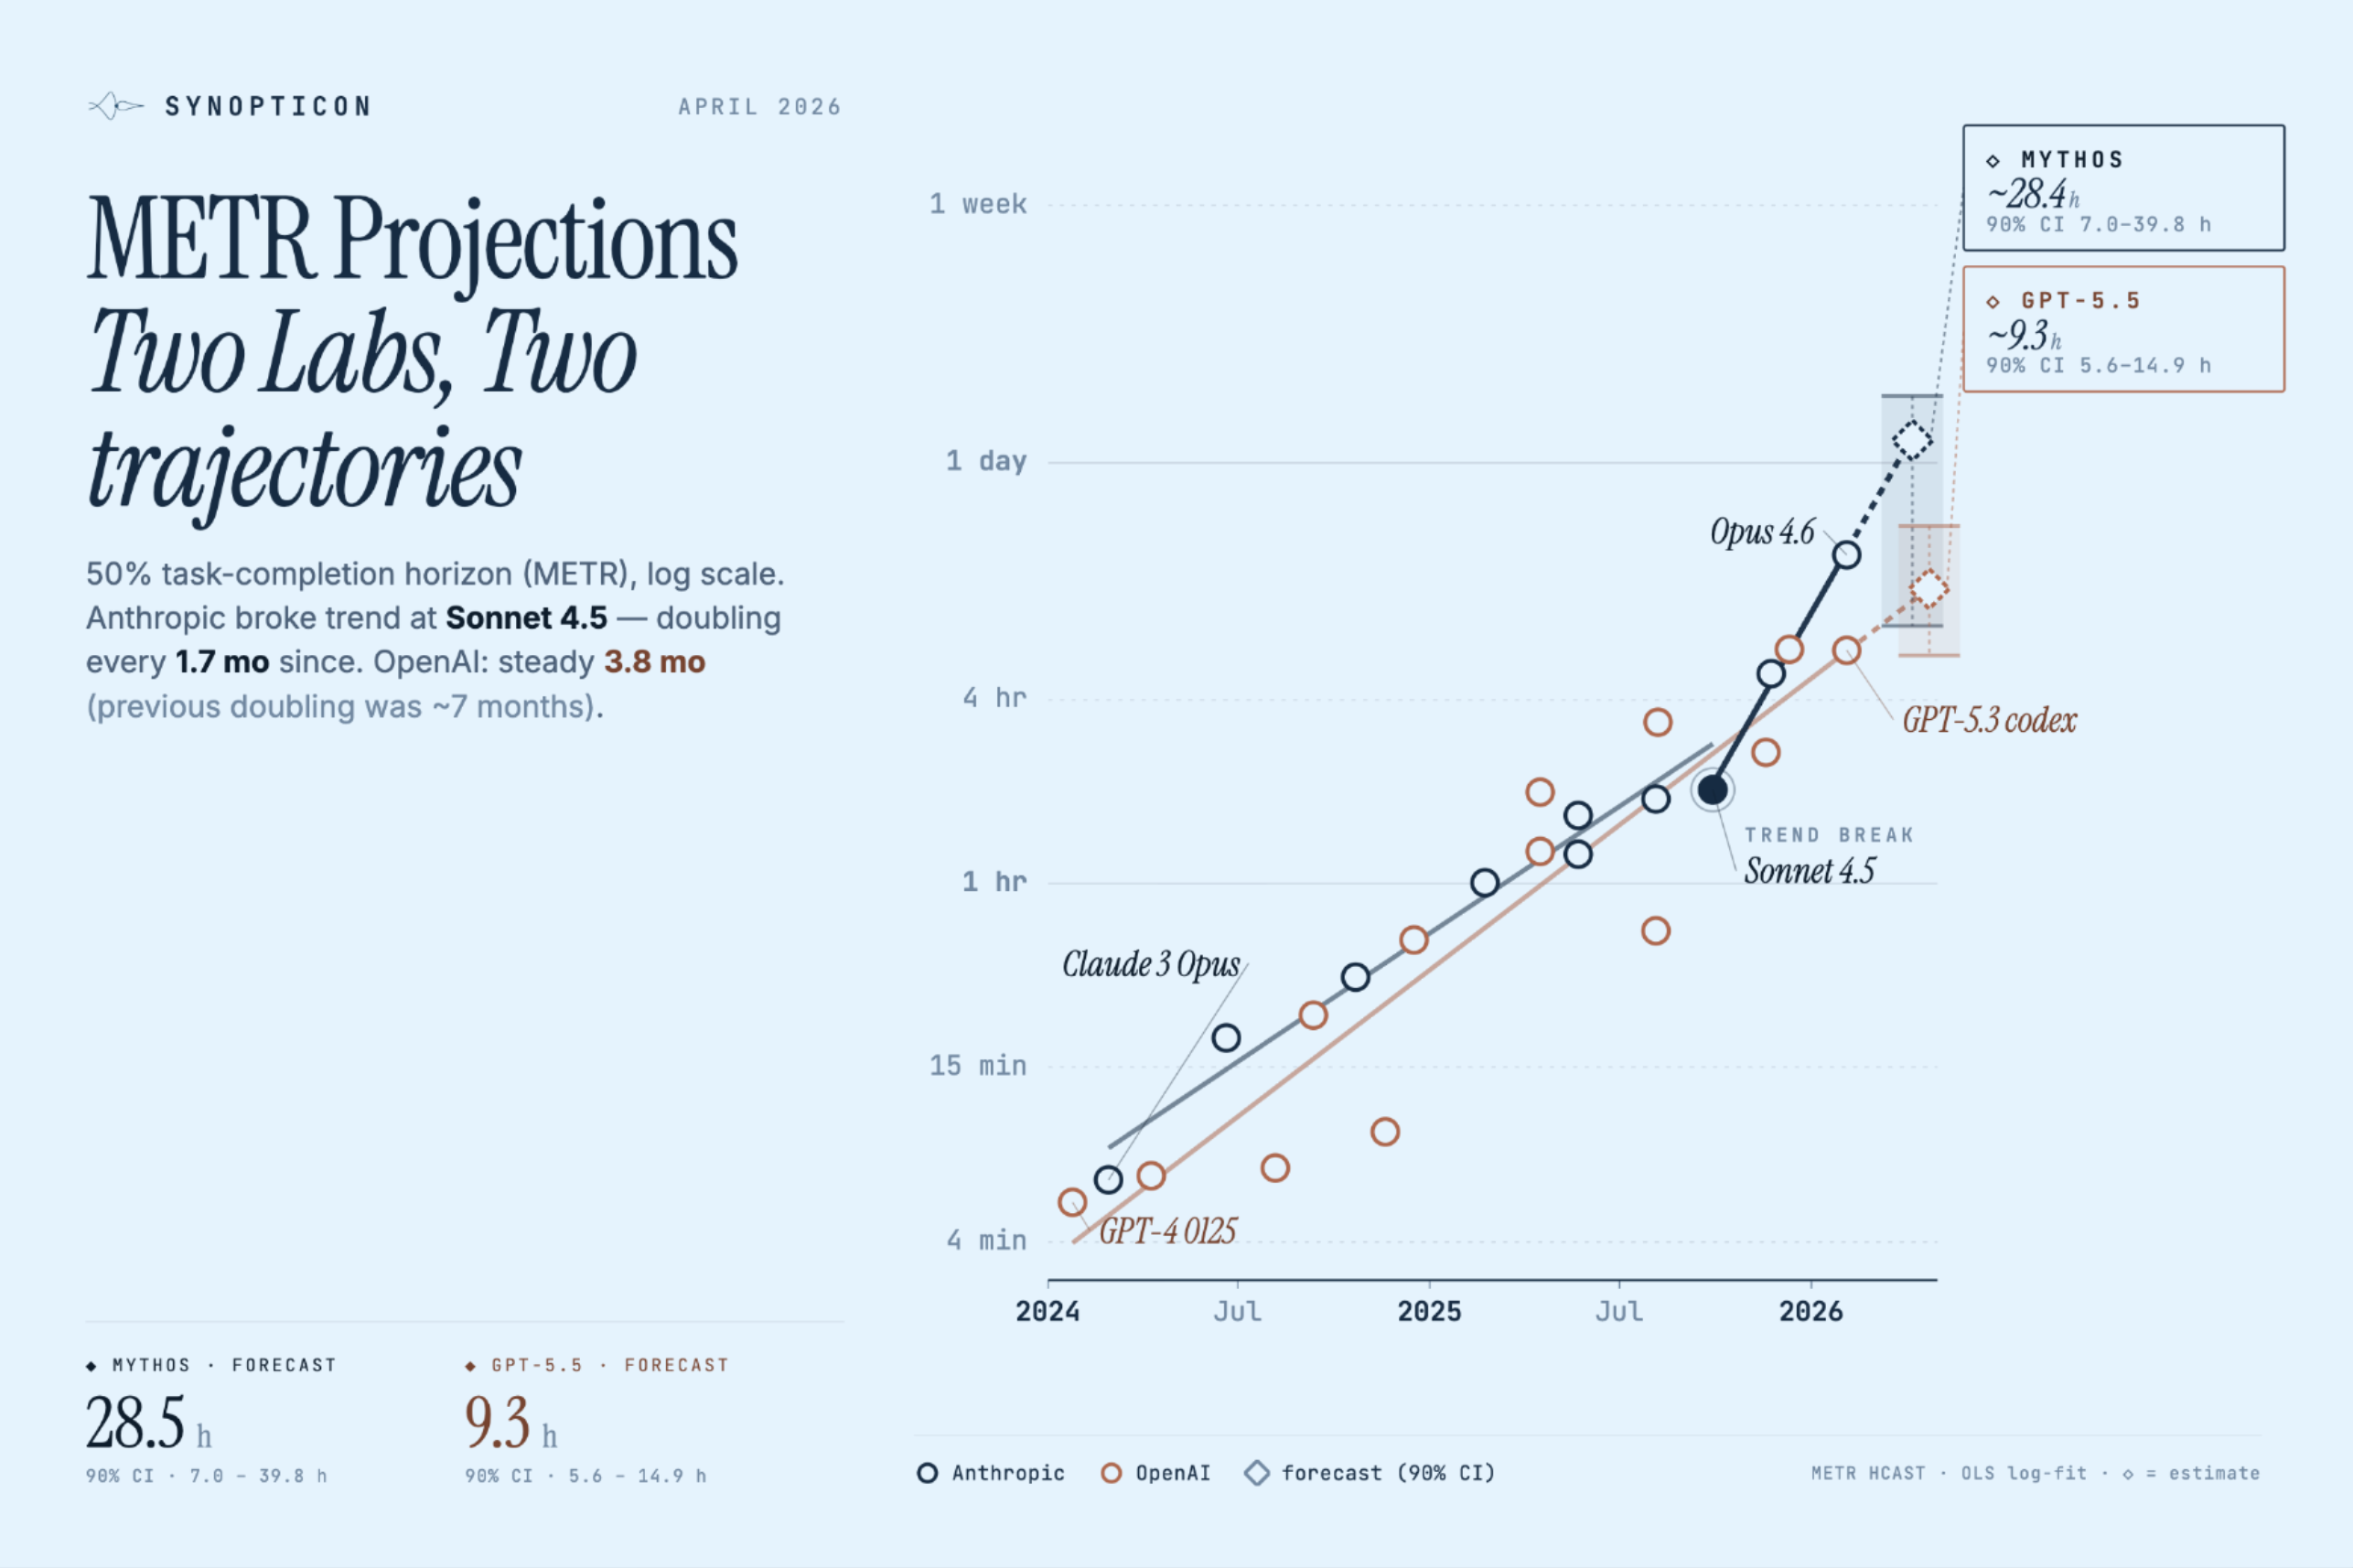
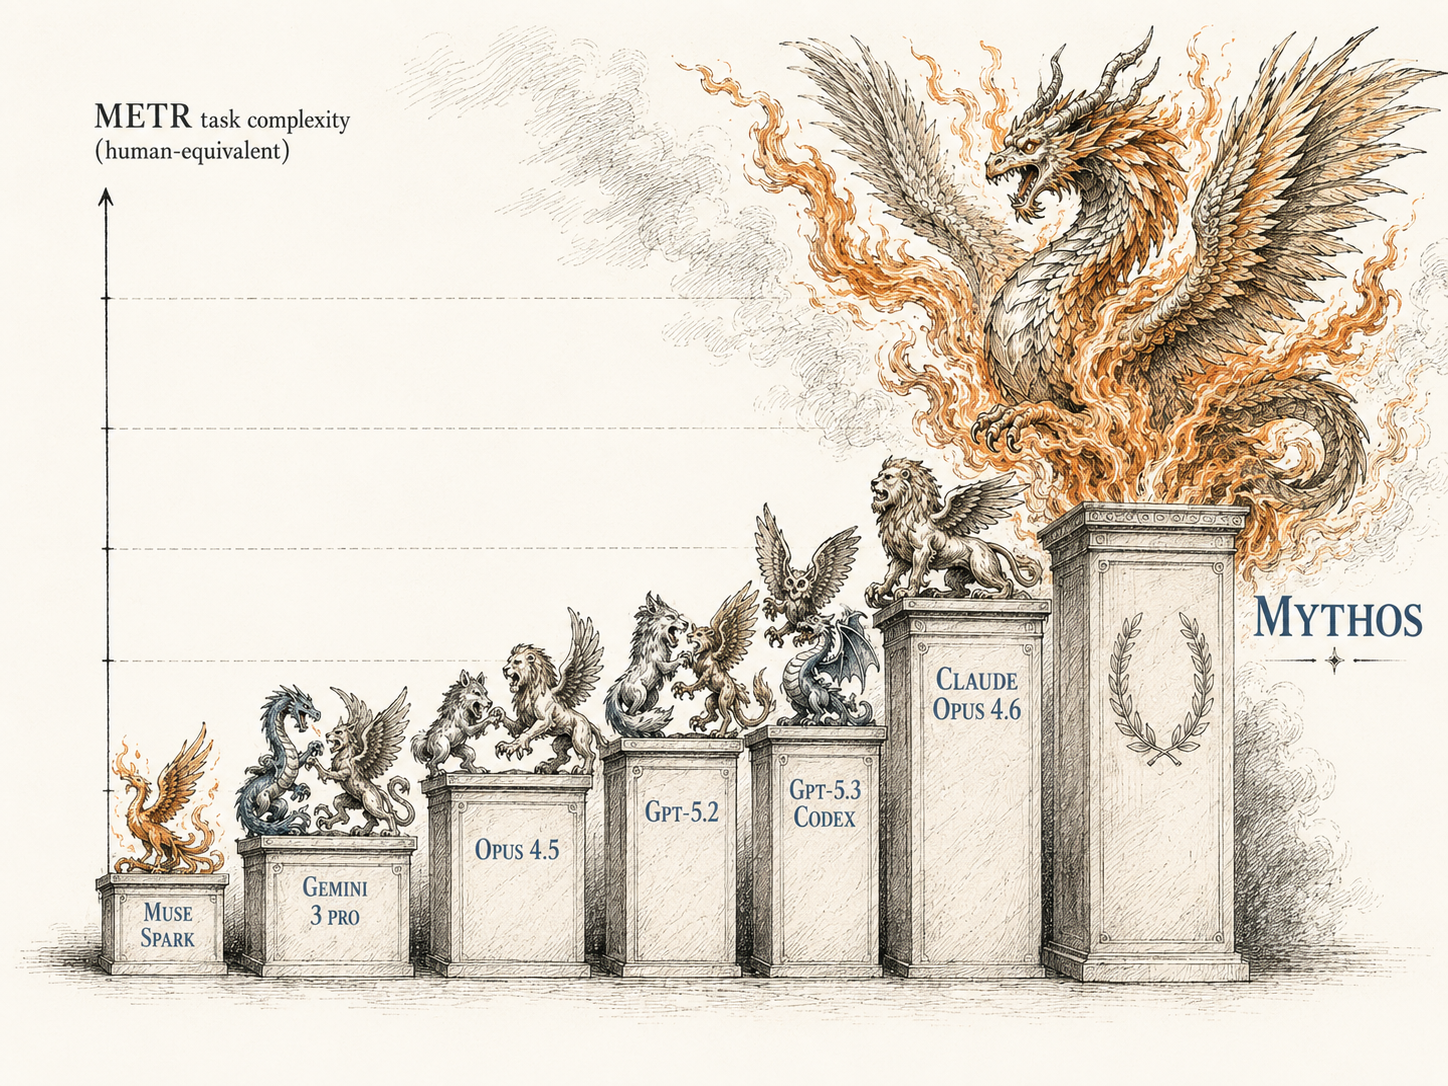
Latest: Anthropic broke the METR trend at Sonnet 4.5 — doubling every 1.7 months while OpenAI holds steady at 3.8. Mythos forecast: 28h, GPT-5.5: 9h.
See all charts →
Subscribed. First research brief coming soon.
Weekly research. No fluff. Unsubscribe anytime.